Aerodynamic Simulation of Rotating Wheels in a Solar Car
Every 2 years competitors from around the world set out on a grueling race across the Australian outback: the World Solar Challenge. The competing solar-powered cars are built by some of the brightest young minds on the planet.

Pre-processing and Meshing News
Pre-processing and Meshing Resources
September 14, 2020
Student teams from all over the world, push the limits of technological innovation by engineering and building a vehicle with their own hands, powered only by the sun. The competition is designed to promote research on solar-powered cars.
The Belgian team Agoria won last year's race with their car called BluePoint. BluePoint is the result of years of research by different teams of thesis students from KU Leuven.
One of the most important objectives of solar-powered car development is to minimize power consumption by reducing drag. To find the optimum design within the limits of the competition, the Agoria Solar Team ran many simulations using OMNIS™, and were able to make a large variety of design changes thanks to its quick and easy, yet high-quality mesh production.
Study of the influence of the rotation of the wheels on the drag
Where in previous aerodynamic simulations of the car, the wheels were not taken into account or considered as static, the thesis of Kristof Borgions and Thomas Holemans [1] discussed in this article, focuses exactly on this part of the car. The influence of the rotation of the wheels in this research was investigated using OMNIS™/Open-DBS with OpenLabs™.
Simulations of the solar car were performed both with rotating wheels and with stationary wheels to be able to evaluate the impact of the rotation on the total drag of the car. A particularly interesting study for comparison of the simulation results with real-life road conditions on rotating wheels and with wind tunnel tests where the wheels are stationary.
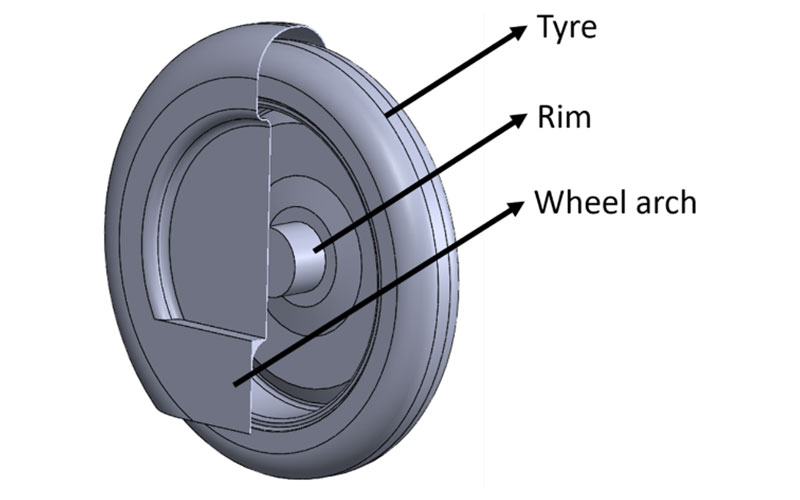
Figure 1: The simplified tire, rim and wheel arch
As a starting point, previous simulations of the car without wheels were considered as performed by Vandervelpen and Uten [2]. To keep computational time within reasonable limits for a master’s thesis work, the rim and tire were simplified. For example the grooves in the tire were not taken into account and the wheel arch was also simplified. The gap for the suspension was closed as the flow inside the car was neglected. In addition, only half of the car was considered in the simulation, neglecting the flow around the canopy.
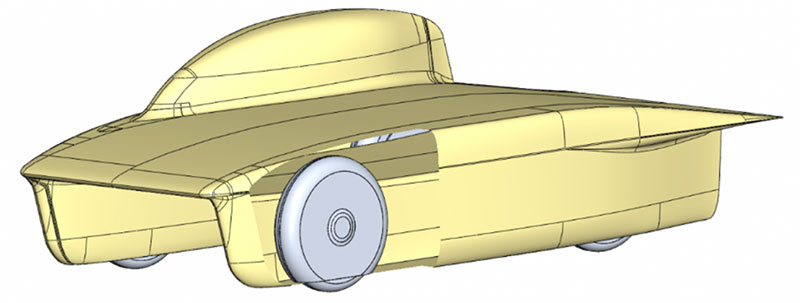
Figure 2: Position of the wheel in the car
Meshing and set-up
Starting from a CAD file in Parasolid format, a full hexahedral mesh was generated of around 11.5 Million cells.
OMNIS™/Hexpress was used to automatically group the many different surfaces from the original CAD. This drastically simplifies the further steps of the simulation process. For example by having all narrow fillet surfaces in a separate group, additional refinements can easily be made to be able to accurately capture the curvature while keeping the cell count limited. The leading as well as the trailing edge of the car can be captured accurately through an appropriate refinement.
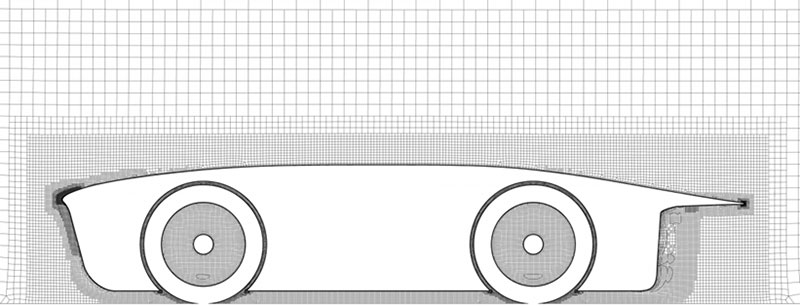
Figure 3: Full hexahedral mesh at the leading edge of the car on a y-constant cut plane
Considering the high focus on the wheels in this work, special attention was put on the meshing of this area. For example, the space between the wheel and the arch needed to be captured accurately. As this is variable, a proximity refinement was used: the cell size was based on the distance between the two surfaces, allowing for a limited cell count.
The simulations in the thesis were performed with the OMNIS™/Open-DBS solver for a 3D unsteady RANS simulation. Based on previous work [2] the k-ω SST turbulence model was used, as this would give the best results compared to wind tunnel measurements.
For the simulation with rotating wheels a Moving Wall boundary condition was used for the wheels, with an imposed radial velocity corresponding to the speed of the car. This was justified as the tire grooves and rim spokes weren’t taken into account. In reality stationary wheels (in a wind tunnel) would correspond to a stationary ground, but in this research a moving floor was imposed to be able to compare the results of calculations made with the same conditions.
Results
The simulations were run on 26 cores with 160 Gb of RAM on a workstation of the ‘Applied Fluid Mechanics and (Aero)Acoustics’ research group of KU Leuven, campus Groep T Leuven. A first steady simulation was performed in 52 hours, corresponding to 4.5 CPU.h/Mpoints. For the unsteady simulations there was a remarkable difference: where the simulation with stationary wheels took 440 hours to stabilize, the simulation with rotating wheels took only 44 hours. This difference can be entirely attributed to the vortex shedding that is observed in the case of stationary wheels. Due to the rotation of the wheels, the amplitude and frequency of vortex shedding was significantly reduced.

Figure 4: Bottom view of the velocity for stationary (left) and rotating (right) wheels
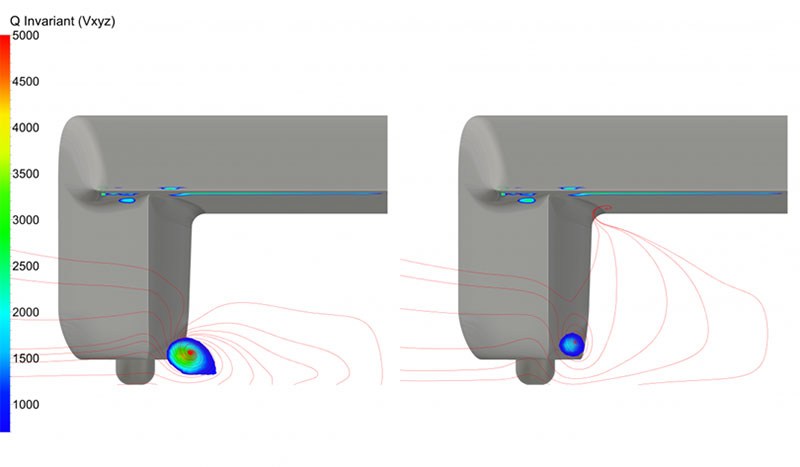
Figure 5: Q-Invariant and surface streamlines (red) on a vertical cut plane downstream of the car (x=-1.8). Stationary wheels (left) show the vortex shedding compared to the rotating wheels (right)
Skin friction drag was influenced only a little by the rotation of the wheels. Pressure drag however showed to be largely impacted. The simulations also demonstrated that the front wheels had higher pressure drag than the back wheels. This can be explained by the lower stagnation pressure for the back wheel, as it is in the wake of the front wheel. Moreover the flow was approaching the back wheel under an angle coming from the vortex shedding caused by the front wheel. The pressure field showed that the pressure in the wake just downstream of the front wheel (on the left), was lower than the pressure in the wake of the back wheel (on the right).

Figure 6: Bottom view of static pressure on horizontal cut
Ultimately the rotation of the wheels reduces the drag on the wheels by approximately 40%. This has significant consequences for the car as a whole, as it reduces the CdA by approximately 10%. Quite a considerable impact.
The simulations provided a more detailed insight in the flow field structures around the wheel caused by rotation. A small recirculation zone can be noticed at the front of the wheel and the wheel arch. Here the free stream flow from upstream and the flow between the wheel and the wheel arch come together.
Figure 7: Streamlines colored by velocity around the front tire
The computed CdA compares within 0.95% with the one measured in a wind tunnel. As the present simulations did not include the canopy, the computed results were corrected based on previous results including the canopy [2].
Conclusion
This work with OMNIS™/Hexpress and OMNIS™/Open-DBS with OpenLabs™ is an example of a work performed by students in the limited time available for a master thesis. It provides more insight into the flow structure around rotating wheels and its significant impact on pressure drag. Rotation of the wheels causes as much as 40% decrease in drag on the wheels, resulting in a 10% reduction of the CdA of the complete car. This work helps in particular to increase confidence in the comparison of simulation results with experimental results in road conditions and wind tunnels.
References
- Borgions K., Holemans T., Aerodynamic simulation of rotating wheels in a solar car. KU Leuven, Faculty of Engineering Technology. Master thesis, 2019.
- Vandervelpen E., Uten J., Testing of turbulence models for the aerodynamic simulations of a solar car, KU Leuven, Faculty of Engineering Technology. Master thesis, 2018.
More NUMECA Coverage
Subscribe to our FREE magazine, FREE email newsletters or both!